


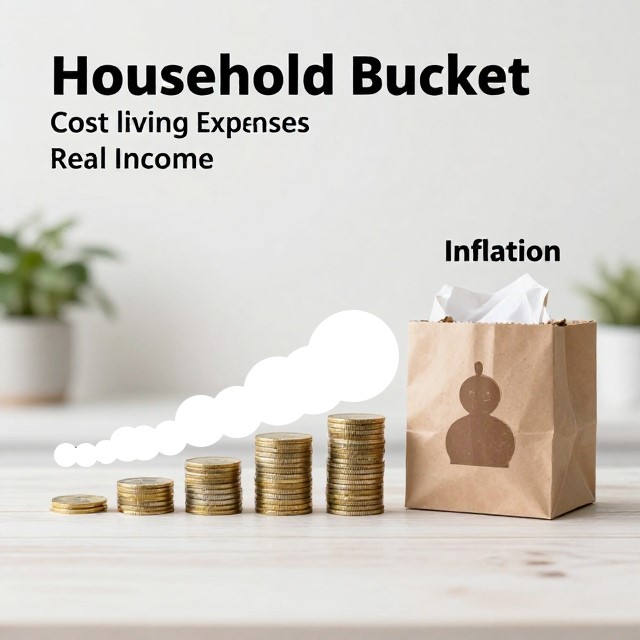
What the new INSTAT data reveals about household budgets and how purchasing power changes for 2023–2026?
The publication by INSTAT of the Household Budget Survey for 2025 provides a new reference point for understanding not only how much Albanian households spend, but also how that spending is structured, how exposed households remain to essential living costs, and how widely these patterns differ across regions.
The new figures become more meaningful when considered alongside previous ALTAX analyses of household expenditure, the income needed for living, and purchasing power during 2023–2025. They show that the household economy cannot be understood simply by looking at the nominal level of expenditure. The more important question is how that expenditure is distributed and how much income remains after essential needs have been covered.
In 2025, an Albanian household spent an average of ALL 95,227 per month on consumption, around 2.3% more than a year earlier. Yet 39.8% of this budget still went to food and non-alcoholic beverages. The increase in nominal consumption has therefore not been accompanied by a major change in the way households allocate their budgets.
This is where the INSTAT data connect directly with the ALTAX analysis. The issue worth bringing into the public debate is how much of the household budget remains available for choice, saving, investment, and protection against future shocks.
The latest series points to a moderate rise in household expenditure. In 2023, average monthly consumption expenditure was ALL 91,675. INSTAT reports ALL 95,227 for 2025, while the 2.3% increase recorded in 2025 implies expenditure of around ALL 93,086 in 2024.
| Year | Average monthly consumption expenditure | Annual change |
| 2023 | ALL 91,675 | +3.7% |
| 2024 | ≈ALL 93,086 | +1.5% |
| 2025 | ALL 95,227 | +2.3% |
The series shows that household consumption has increased in nominal terms, but not rapidly. Between 2023 and 2025, expenditure rose from ALL 91,675 to ALL 95,227, an increase of around 3.9%.
At first sight, this could be read as an improvement. But that conclusion is incomplete without looking at where the additional spending goes. When much of the increase is absorbed by food, housing, energy, and transport, higher nominal consumption does not necessarily mean a comparable improvement in welfare.
This is why the analysis of the cost of living needs to move beyond average expenditure and look more closely at the structure of household spending.
The figures show that Albanian households remain strongly oriented toward basic needs.
The 2025 data are particularly revealing in this respect. The share of food and non-alcoholic beverages increased from 39.6% to 39.8%, while housing and related services accounted for 9.7% and transport for 7.2%.
| Consumption category | 2024 | 2025 | Change |
| Food and non-alcoholic beverages | 39.6% | 39.8% | +0.2 pp |
| Alcohol and tobacco | 4.2% | 4.3% | +0.1 pp |
| Clothing and footwear | 5.1% | 5.0% | -0.1 pp |
| Housing, water, energy and rent | 9.6% | 9.7% | +0.1 pp |
| Furnishings and maintenance | 6.8% | 6.6% | -0.2 pp |
| Health | 3.8% | 3.4% | -0.4 pp |
| Transport | 7.1% | 7.2% | +0.1 pp |
| Communication | 3.8% | 3.7% | -0.1 pp |
| Recreation and culture | 2.6% | 2.8% | +0.2 pp |
| Education | 3.3% | 3.3% | 0 |
| Restaurants and hotels | 7.6% | 7.5% | -0.1 pp |
| Miscellaneous goods and services | 6.4% | 6.6% | +0.2 pp |
Source: INSTAT, HBS 2025.
The 39.8% share of food is perhaps the clearest socio-economic signal in the new data. As real incomes and living standards rise, households generally devote a smaller share of their budgets to food and can allocate more to services, education, culture, leisure, savings, and investment.
In Albania, that transition remains limited.
A substantial part of household consumption is still tied to essential expenditure that cannot easily be postponed.
When food, housing, and transport are combined, they account for 56.7% of total household consumption.
| Three main components | Share in 2025 |
| Food and non-alcoholic beverages | 39.8% |
| Housing, water, energy and rent | 9.7% |
| Transport | 7.2% |
| Total | 56.7% |
More than half of the average household budget is therefore absorbed by three essential areas of everyday life.
This points to an important distinction: consumption is increasing, but household economic capacity is not necessarily expanding at the same pace.
Food remains the clearest pressure point for purchasing power
In 2025, households spent an average of ALL 37,859 per month on food and non-alcoholic beverages. Vegetables, meat and meat products, and milk, cheese and eggs accounted for the largest shares.
| Main food components | Share |
| Vegetables | 20.2% |
| Meat and meat products | 16.6% |
| Milk, cheese and eggs | 15.5% |
This structure also matters when interpreting inflation.
A general inflation rate of, for example, 3% does not create the same pressure on every household. A household that spends around 40% or more of its budget on food is much more exposed to food-price increases than one that spends 20% or less.
For Albania, therefore, measuring purchasing power requires more than looking at average inflation. It also requires considering inflation weighted by the actual structure of household consumption.
This is one of the arguments at the centre of ALTAX’s purchasing-power analysis, and the latest INSTAT data make it even more relevant.
Regional differences remain substantial
Another important finding of HBS 2025 is the persistent gap between regions.
| Region | Average monthly consumption expenditure, 2025 |
| Tirana | ALL 110,904 |
| Korçë | ALL 93,381 |
| Durrës | ALL 91,992 |
| Dibër | ALL 77,027 |
| Kukës | ALL 76,009 |
Source: INSTAT, HBS 2025.
Tirana records average monthly consumption of ALL 110,904, compared with ALL 76,009 in Kukës. The difference is ALL 34,895 per month, or around ALL 418,740 per year for one household.
The ratio between the two extremes is approximately 1.46 to 1.
A similar gap was identified in ALTAX’s analysis for 2023–2025, when expenditure in Tirana was around ALL 108,588 compared with ALL 75,048 in Kukës.
This suggests that territorial inequality is not simply a temporary deviation. It has become a relatively persistent feature of the Albanian household economy.
That also means that the national “average household” can be misleading. A household in Tirana and one in Kukës may face very different economic realities even though both are represented by the same national average.
The regional difference, however, needs to be interpreted carefully.
Higher expenditure in Tirana reflects not only greater purchasing power but also higher housing, service, transport, and urban consumption costs.
Similarly, lower expenditure in regions with weaker consumption cannot automatically be treated as evidence of a lower cost of living. Home ownership, self-production, remittances, the informal household economy, and demographic differences may all influence the figures.
For this reason, the more useful question is not simply how much households spend, but how much income they need to sustain that expenditure structure.
From consumption to affordability
This shifts the discussion from observed consumption to affordability.
INSTAT measures what households actually consume.
Economic and policy analysis can go one step further by estimating the income a household would need to cover its expenditure while maintaining an acceptable standard of living.
In ALTAX’s 2026 analysis, the projected interval for average monthly expenditure was ALL 99,000–105,000. For a basic but decent standard of living, the estimated net income requirement was ALL 105,000–170,000, rising to around ALL 126,000–200,000 for a family of four.
These figures should not be compared directly with INSTAT’s ALL 95,227 as though they represented the same indicator. The INSTAT figure is observed average consumption, while the ALTAX intervals are normative and forward-looking estimates of the income needed to support a given standard of living.
That distinction matters. A household may spend less than what would be required for a sustainable standard of living not because its cost of living is lower, but because its income does not allow it to spend more.
This points toward a potentially useful indicator: the Household Affordability Gap.
In its simplest form:
Affordability Gap = Net household income – Necessary living expenses
If the result is positive, the household has room for saving, investment, or protection against shocks.
If it is zero, the household is operating at the full limit of its income.
If it is negative, the gap has to be covered through debt, previous savings, family support, remittances, or reductions in other forms of consumption.
Such an indicator could provide a more meaningful measure of household economic resilience than expenditure alone.
Consumption is diversifying, but basic needs still dominate
The data do not describe a household economy limited entirely to basic necessities. Spending on recreation and culture increased from 2.6% to 2.8%, while restaurants and hotels still account for 7.5% of the household budget.
This indicates that Albanian consumption is becoming more diversified.
But the change has not yet been large enough to alter the dominant role of basic needs. The Albanian household in 2025 is gradually diversifying its consumption, but has not yet reached a structure in which essential needs account for a relatively small share of the budget.
This can be understood as part of a broader transition in household welfare.
The decline in the share of health expenditure, from 3.8% to 3.4%, also deserves attention. By itself, this cannot be interpreted as either an improvement or a deterioration in welfare.
If the decline reflects lower prices, better public coverage, or reduced health needs, it may be positive. If, however, households are cutting health expenditure to protect other parts of the budget, the signal is very different. In that case, health spending becomes an indicator of how households absorb economic shocks.
Is household consumption approaching a new cost-of-living threshold in 2026?
ALTAX’s 2026 projection placed monthly household expenditure in the range of ALL 99,000–105,000.
Compared with the ALL 95,227 measured by INSTAT for 2025:
| Comparison | Value |
| Average INSTAT consumption 2025 | ALL 95,227 |
| Lower bound of ALTAX 2026 projection | ALL 99,000 |
| Difference | +ALL 3,773 |
| Upper bound of ALTAX 2026 projection | ALL 105,000 |
| Difference | +ALL 9,773 |
The ALTAX projection therefore remains within a plausible range relative to the level measured by INSTAT. It places a moderate interval above the 2025 consumption baseline.
But this should not be confused with the income required for a sustainable standard of living.
Average consumption expenditure is not the same thing as the income needed to live sustainably.
The HBS 2025 data do not describe an Albanian household that has stopped consuming. On the contrary, consumption has increased and is gradually becoming more diversified. What the data also show, however, is that the transition toward higher welfare remains incomplete.
The increase in consumption should therefore not automatically be interpreted as a proportional increase in living standards.
The Albanian household is consuming more, but it has still not gained enough economic space.[1]
This is where the 2025 INSTAT data and ALTAX’s previous work come together and point toward a broader research agenda: measuring the gap between realized consumption, disposable income, and the income required for a sustainable standard of living.
[1] Economic space is the portion of income that remains after basic needs have been met and can be used for savings, education, health, investment, leisure, and protection against unexpected shocks.

Leave a Reply
You must be logged in to post a comment.