Tax burden, structure, and tax rates in Western Balkans 2024
The tax burden includes taxes on consumption (indirect for the form addressed to individuals and businesses), direct taxes addressed directly to personal income from work, capital gains to individual and corporate income, and general taxes (including all forms of national or subnational taxes that are applied for the use of natural resources, for services received by public institutions), as a percentage of GDP.
| Tax Burden in the Western Balkans, 2021 -2023 | ||||
| 2021 | 2022 | 2023 | 3 vite | |
| Albania | 25.6 | 25.3 | 25.8 | 25.6 |
| Bosnia-Herzegovina | 36.8 | 36.0 | 36.1 | 36.3 |
| Kosovo | 24.5 | 24.8 | 25.7 | 25.0 |
| Montenegro | 37.9 | 34.3 | 36.2 | 36.1 |
| North Macedonia | 27.2 | 27.7 | 28.5 | 27.8 |
| Serbia | 38.6 | 38.9 | 37.1 | 38.2 |
| Western Balkans | 31.8 | 31.2 | 31.6 | 31.5 |
| Source: IMF, MF | ||||
So, the tax burden is the indicator of tax obligations paid in the state budget/local budgets and mandatory insurance for contributions from citizens and licensed economic activities in respect of their return to public goods and services.
In the last two years 2021-2022, the tax burden is at the level of 31.8% and 31.2% of the GDP of the Western Balkans (WB6). This share of the fiscal burden is decreasing by 0.6% of GDP.
In 2023, the tax burden is 31.6% of GDP of WB6 countries and shows an average decrease compared to 2021.
However, the level of the fiscal burden in WB6 countries is 9.4% percentage points below the level of the burden in the EU[1].
This high difference does not come from the changes in the legal package, since the legislations of WB6 countries have been aligned to the same acquis communautaire[2].
But the difference in the dislevel of the tax burden is strongly influenced by the will to tax by the governments of WB6 countries, by weak capacities and patronage and by corruption and still high informality.
This inconsistent will can be seen in the way the political leaders who direct the tax policy in recent years use it through the approval of tax breaks and damage to fiscal neutrality), but also through cronyism or the appointment of preferential individuals in the management of administrations and outside the framework of meritocracy.
In the meantime, the fiscal policy has resulted in a non-neutral impact, when it should be used as an incentive instrument in sync with other reforms to promote investment and productivity.
The main argument that supports the description of the performance of the fiscal system in WB6 is the indicator of the tax burden in all countries, which has remained unchanged in relation to the average level in the last 3 years.
The variability in the level of the fiscal burden in WB6 countries has its own specific regional reasons that are influenced by:
narrow basis for each tax,
– tax relief policies that started from small economic stimulus effects seem to have arguments for electoral motives,
– loss of trust in government,
– the still high dependence on consumption taxes that have also affected the burden,
– insufficient administrative capacities, as well as
– fiscal culture still below the expected level of voluntary compliance in calculating, declaring and paying taxes and duties.
This set of factors creates a gap between the budget program to collect tax revenue and actual collections by fiscal administrations.
| Tax burden according to structure, 2023 | % GDP | ||||
| Countries | VAT | CIT | PIT | Soc. Contrib. | Other taxes |
| Albania | 8.3 | 2.8 | 2.5 | 6.2 | 6.0 |
| Kosovo | 13.3 | 2.0 | 2.7 | 0.0 | 7.7 |
| Montenegro | 14.0 | 1.9 | 3.2 | 8.0 | 9.1 |
| North Macedonia | 8.1 | 2.0 | 3.1 | 10.2 | 5.1 |
| Serbia | 10.5 | 2.7 | 4.2 | 13.0 | 6.7 |
| Bosnia-Herzegovina* | 17.6 | 1.8 | 1.8 | 14.5 | 0.4 |
| * VAT & Excise | 11.4 | 2.2 | 2.9 | 10.4 | |
| Sourcei: IMF, MF | |||||
In analyzing the weight of taxes and fees and their impact on fiscal revenues, we have specifically addressed the weight it should bear in the organization of the fiscal system of each country.
The table above shows that the structure of the fiscal burden in 2023 is constructed differently from the structure of taxes in EU countries[3]. Compared to the same analysis for the periods in previous years, it seems that the structure of the component base of the tax systems has changed little[4].
Tax burden of WB6 consists of over 38% of VAT (except for Bosnia-Herzegovina which also includes excise), 12% of capital tax and 37% of labor taxes (TAP and contributions). The remaining 13% consists of national taxes, local taxes and fees and customs and excise duties..
Tax systems in WB6 still have the greatest dependence on VAT and labor taxes (tax on labor income and insurance contributions).
In the 5 WB6 countries (excluding BiH), VAT payments carry a weight of 36% of the tax burden, with a decrease from 2021 by 3 percentage points.
Distribution of the VAT burden according to WB6 countries.
In Kosovo, the VAT burden is 52% of the entire fiscal burden and has not changed since 2021.
In Bosnia and Herzegovina (BiH), the VAT burden is 42% of the fiscal burden, with the same weight as before.
In Montenegro, the weight of the VAT burden is 39% of the fiscal burden, with a decrease in weight from 2021.
In Albania, the impact of the VAT burden is 32% of the fiscal burden, with a decrease of 3 percentage points from 2021.
In North Macedonia and Serbia, the VAT burden is the lowest in the region at 28% of the fiscal burden, where respectively with a decrease of 2 percentage points from 2021 or in the case of Serbia it has not changed.
| WB6: VAT burden, 2019 – 2023 | % GDP | |||||
| 2019 | 2020 | 2021 | 2022 | 2023 | 5 – vite | |
| Albania | 7.8 | 7.9 | 8.7 | 9.0 | 8.3 | 8.3 |
| Kosovo | 11.4 | 10.9 | 12.3 | 12.9 | 13.3 | 12.2 |
| Montenegro | 14.1 | 12.7 | 14.2 | 13.8 | 14.0 | 13.8 |
| North Macedonia | 7.5 | 7.1 | 8.0 | 8.2 | 8.1 | 7.8 |
| Serbia | 10.2 | 10.0 | 10.5 | 11.0 | 10.5 | 10.4 |
| Bosnia-Herzegovina* | 19.1 | 17.9 | 19.2 | 18.1 | 17.6 | 14.4 |
| * VAT & Excise | ||||||
| Source: IMF, MF | ||||||
In the table we see that the burden of VAT in relation to GDP has small changes and that support the argument that tax policy and administration have not yet succeeded in shifting the tax burden from consumption to labor and capital.
The high weight of the VAT burden, as seen from its average in the last 5 years, is a very big impact on today’s economy, which needs a reduction in the prices of many products for citizens, but also of the costs of goods and services for businesses. In fact, a high level of the VAT burden in the budget has been collected precisely by businesses, which have taxed citizens through high tax rates and with slightly reduced rates for basic products and some raw materials for the manufacturing economy.
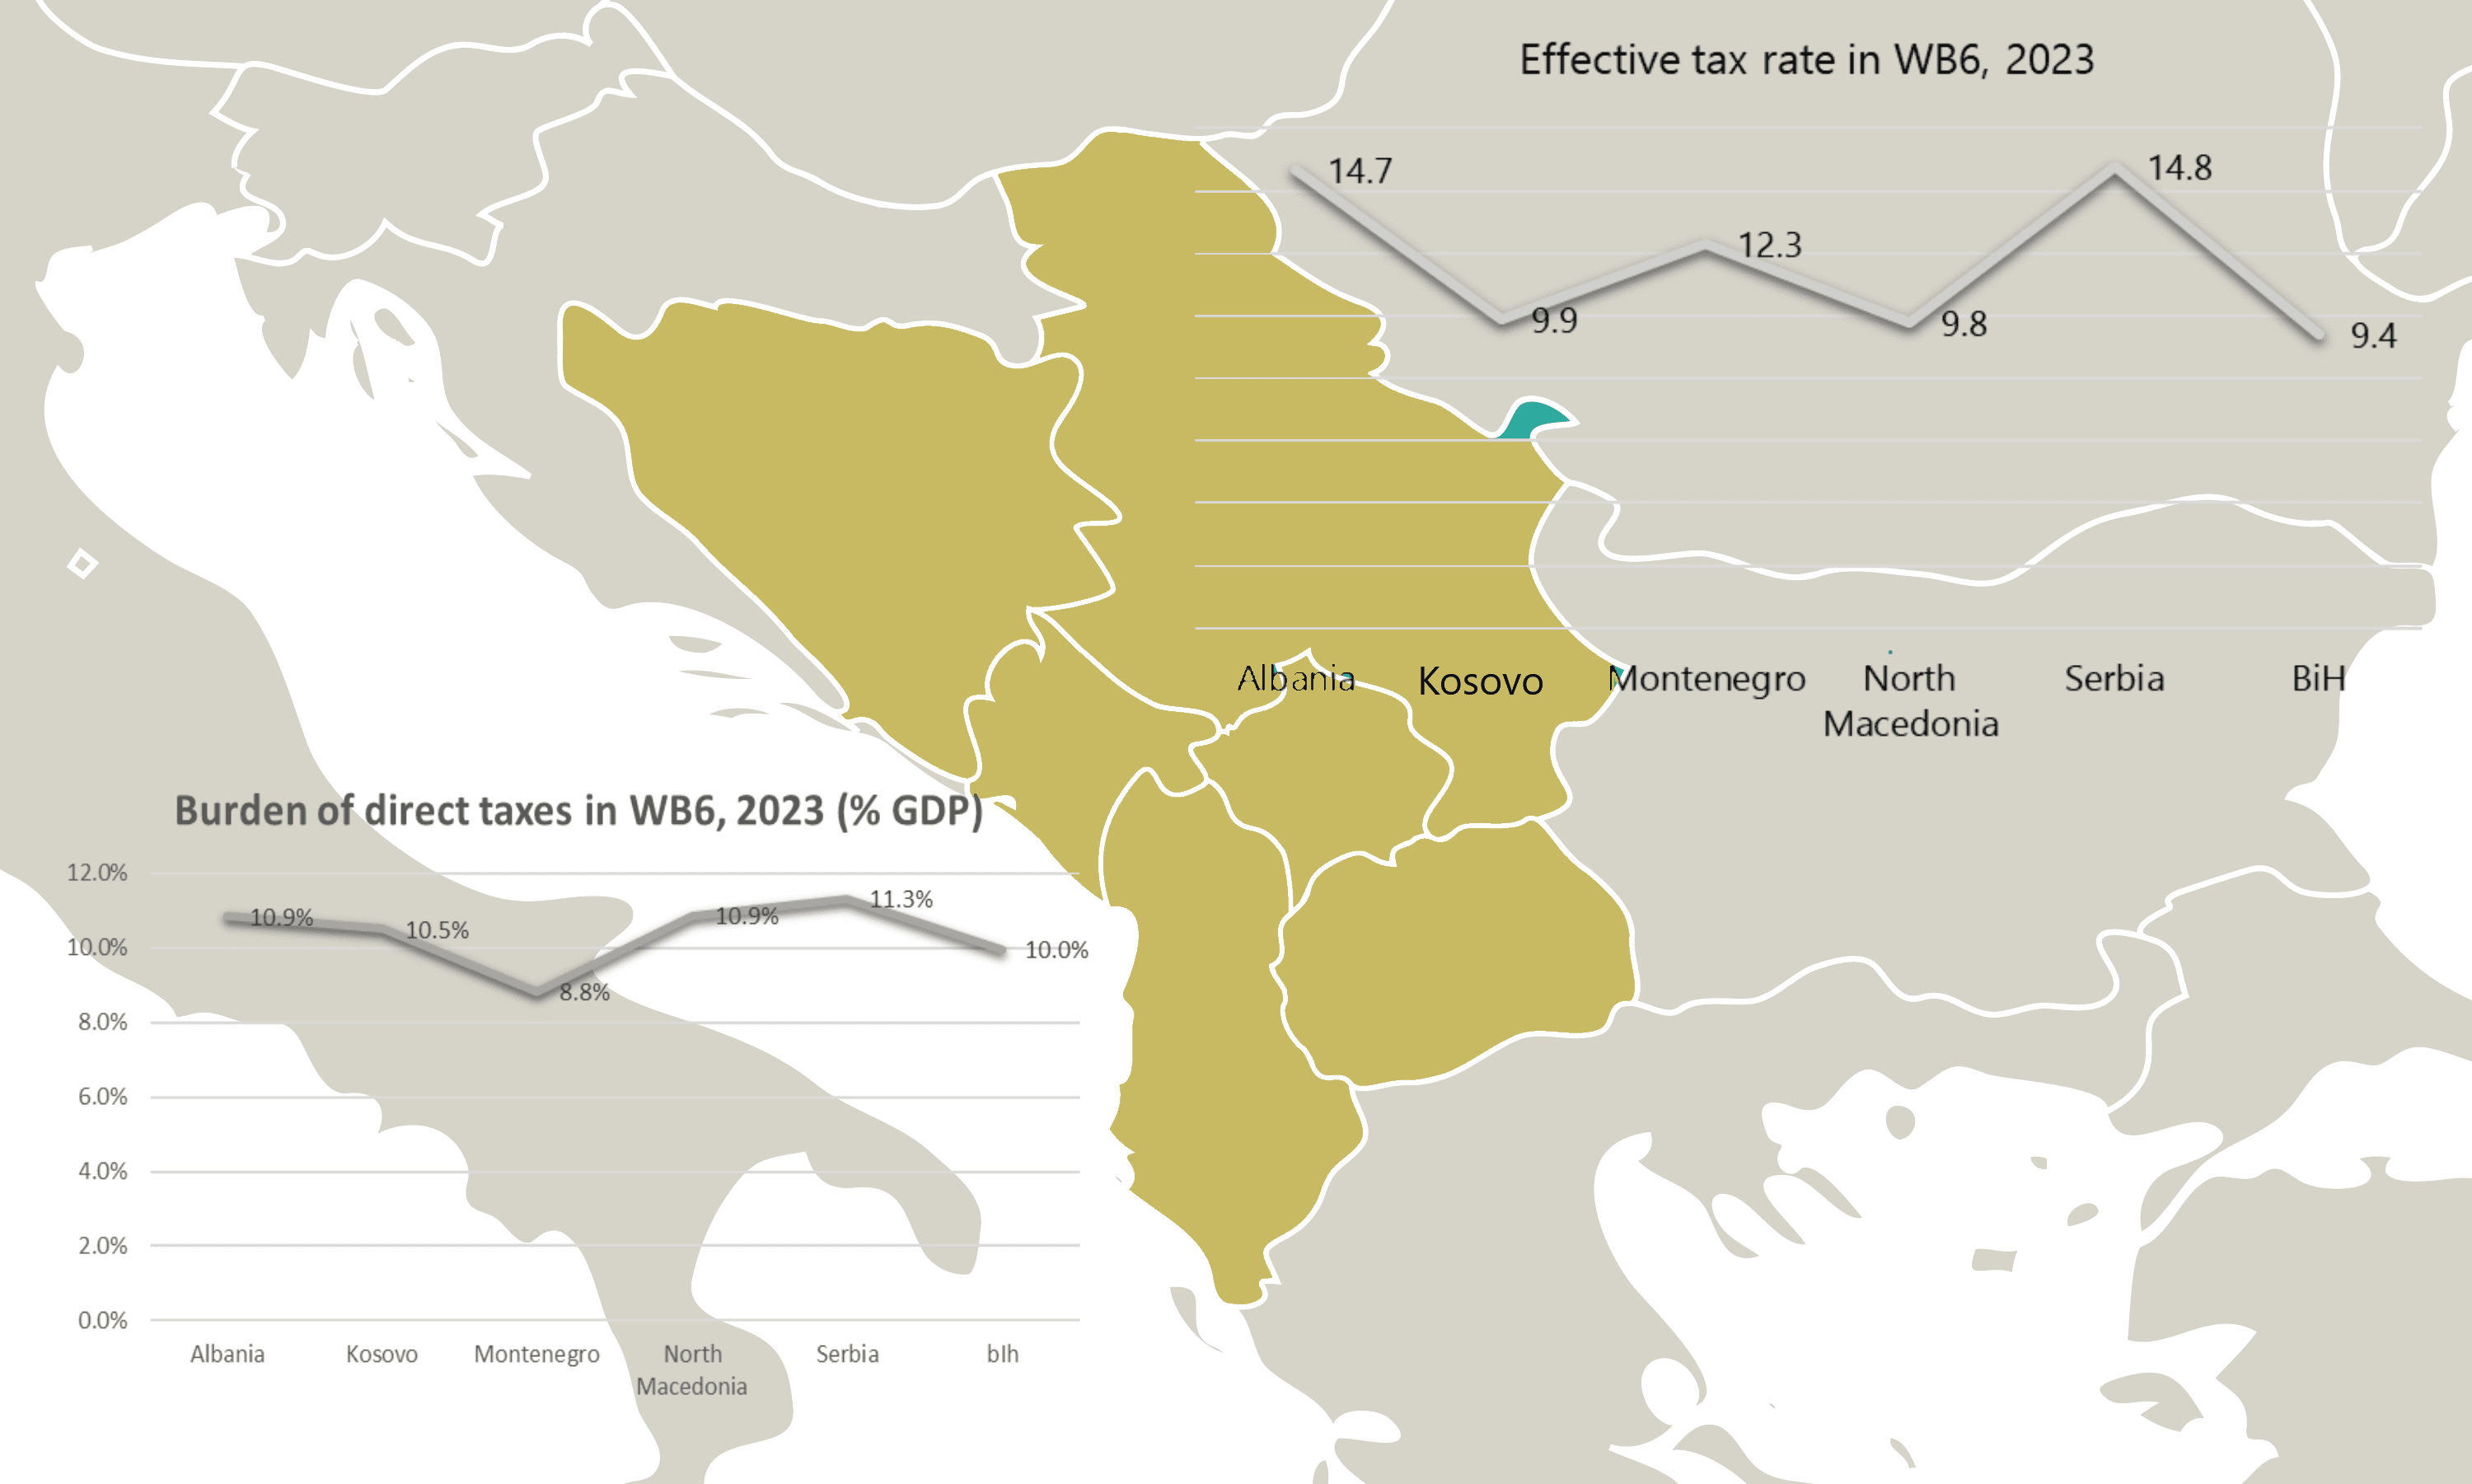
Burden from direct taxes in 2023, which include capital tax and tax[5] on labor income, constitute 16% of the tax burden in WB6. We see the burden of direct taxes distributed and with visible changes in WB6 countries. Albania has the highest level of direct tax burden[6] in 2023, where citizens pay taxes equal to 20.5% of GDP. The main weight in direct taxes is the profit tax (as much as 10.9% of GDP)
Burden of direct taxes in WB6, 2023 (% GDP)
| Countries | Year 2023 |
| Albania | 10.9% |
| Kosovo | 10.5% |
| Montenegro | 8.8% |
| North Macedonia | 10.9% |
| Serbia | 11.3% |
| Bosnia-Herzegovina | 10.0% |
The citizens and businesses of Serbia follow, paying direct taxes of 18.6% of GDP. The main weight in direct taxes is carried by personal income tax (as much as 11.3% of GDP).
In third place are the citizens and businesses of Kosovo who pay direct taxes amounting to 18.3% of their GDP. The main weight in direct taxes is carried by personal income tax (as much as 10.5% of GDP).
The citizens and businesses of North Macedonia also pay at slightly lower levels, with a direct tax burden of 17.9% of their GDP. The main weight in direct taxes is carried by personal income tax (as much as 10.9% of GDP).
Meanwhile, the other two countries (Montenegro and BiH) are far from this level of tax burden as above and carry a direct tax burden of 14.1% of the Montenegrin GDP and 10% of the GDP of the BiH.
The main weight in the direct tax burden in Montenegro is borne by personal income tax (8.8% of GDP). While the main weight in the burden of direct taxes in BiH is held equally by both types of taxes (5% to 5% of GDP).
From the burden of direct taxes in 2023 in each BP6 country, we see that within this group that taxes labor and capital, we must also look at the weight of social security contributions.
Burden of insurance contributions 2023 in BP6 (% GDP)
| Countries | Year 2023 |
| Albania | 6.2 |
| Kosovo | 0.0 |
| Montenegro | 8.0 |
| North Macedonia | 10.2 |
| Serbia | 13.0 |
| Bosnia-Herzegovina | 14.5 |
The country with the highest burden in BP6 for the payment of social security contributions[7] is BiH with the level of 14.5% of the country’s GDP. In the same way, Serbia is also part of the countries with a high burden of social security contributions, as citizens receive a sum of payments equal to 13% of the country’s GDP.
North Macedonia, Montenegro and Albania have a moderate to low level compared to the two countries above in this regard.
North Macedonia collects insurance contributions as income in the state budget at a level of 10.2% of GDP, while Montenegro collects 8% of GDP. Albania is in the last place for the low burden of social insurance and health contributions, with a burden that is 6.2% of GDP
Notice! Kosovo does not directly collect payments for social and health insurance on account of the state budget, as it implements a scheme based on organizations with special status[8] , which are not part of the direct tax burden. However, even in Kosovo, both the employer and the employee are subject to mandatory pension contributions in Kosovo. The total mandatory contribution is 10%, where 5% represents the employee’s share (withheld from the gross salary) and 5% the employer’s share.
| Tax burden according to the standard rates of TF and TAP in WB6, 2021 – 2023 (% GDP) | ||||||||||
| Countries | CIT rate (%) | Corporate Income Tax (CIT) | PIT rate (%) | Personal Income Tax (PIT) | ||||||
| 2021 | 2022 | 2023 | Average | 2021 | 2022 | 2023 | Average | |||
| Albania | 5, 15 | 1.9 | 2.2 | 2.8 | 2.3 | 0, 8, 13, 23 | 2.1 | 2.1 | 2.5 | 2.2 |
| Kosovo | 3, 9, 10 | 1.4 | 1.8 | 2.0 | 1.7 | 0, 4, 8, 10 | 2.4 | 2.4 | 2.7 | 2.5 |
| Montenegro | 9, 12, 15 | 1.6 | 1.6 | 1.9 | 1.7 | 0, 9, 15 | 4.0 | 3.8 | 3.2 | 3.7 |
| North Macedonia | 1, 10 | 1.5 | 1.9 | 2.0 | 1.8 | 10, 15, 70 | 2.8 | 2.8 | 3.1 | 2.9 |
| Serbia | 15 | 2.5 | 2.9 | 2.7 | 2.7 | 10, 15 | 3.7 | 4.1 | 4.2 | 4.0 |
| Bosnia-Herzegovina | 10 | 1.7 | 1.7 | 1.8 | 1.7 | 2, 10 | 1.8 | 1.8 | 1.8 | 1.8 |
| Source: IMF, MF | ||||||||||
If we look at the effective tax rate[9] for individuals and businesses, based on the tax burden indicators above (Tab 14) and other macroeconomic indicators, it turns out that the average for BP6 countries is 11.8%.
Compared to EU countries[10], which have an effective tax rate of 19.7%, it is seen that there is a difference that is 7.9 percentage points lower.
The highest level is maintained by Serbia with 14.8% followed by Albania with 14.7% and Montenegro with 12.3%. Whereas, other countries have a lower effective tax rate that reaches up to 9.4% in BiH.
The effective tax burden for direct taxes is lower especially in Kosovo, BiH and North Macedonia.
On the other hand, this shows a dependence of tax revenues on consumption, influenced by the values of foreign investments for some countries, but also by the consumption structure of the population.
All WB6 countries are dependent on consumption taxes and naturally this affects a lower effective tax burden.
In 2023, the effective tax burden increases in Albania, Serbia, Kosovo and Montenegro. Each of these countries has an increasing level of receipts from profit tax and personal income tax above the average level of the last 5 years.
[1] https://ec.europa.eu/eurostat/statistics-explained/index.php/Tax_revenue_statistics
[2] the legal basis of the European Union
[3] https://taxation-customs.ec.europa.eu/system/files/2023-08/ART%20-%20Report%202023_Digital%20Version_1.pdf
[4] https://altax.al/barra-tatimore-ne-ballkanin-perendimor-ne-2022/
[5] Capital gains are profit from the sale or rental benefit of a capital asset (land, building, physical money, virtual money, movable property, shares in a company, things)
[6] payroll tax and other taxes on personal income from labor and capital, including tax on business profits
[7] Above, they are included in the group of labor taxes, based on their relationship with the employee’s salary, but in this analysis they are treated separately
[8] https://bqk-kos.org/mbikeqyrja-financiare-2/licencimi-i-institucioneve-financiare/fondet-pensionale/
https://fssh.rks-gov.net/page.aspx?id=1,19
[9] The term effective tax rate refers to the percentage of income that an individual or business pays in taxes and fees. The effective tax rate for individuals is the average rate at which their earned income, such as wages, and unearned income, such as stock dividends, are taxed. The effective tax rate for a corporation is the average rate at which its pre-tax profits are taxed.


Leave a Reply
You must be logged in to post a comment.