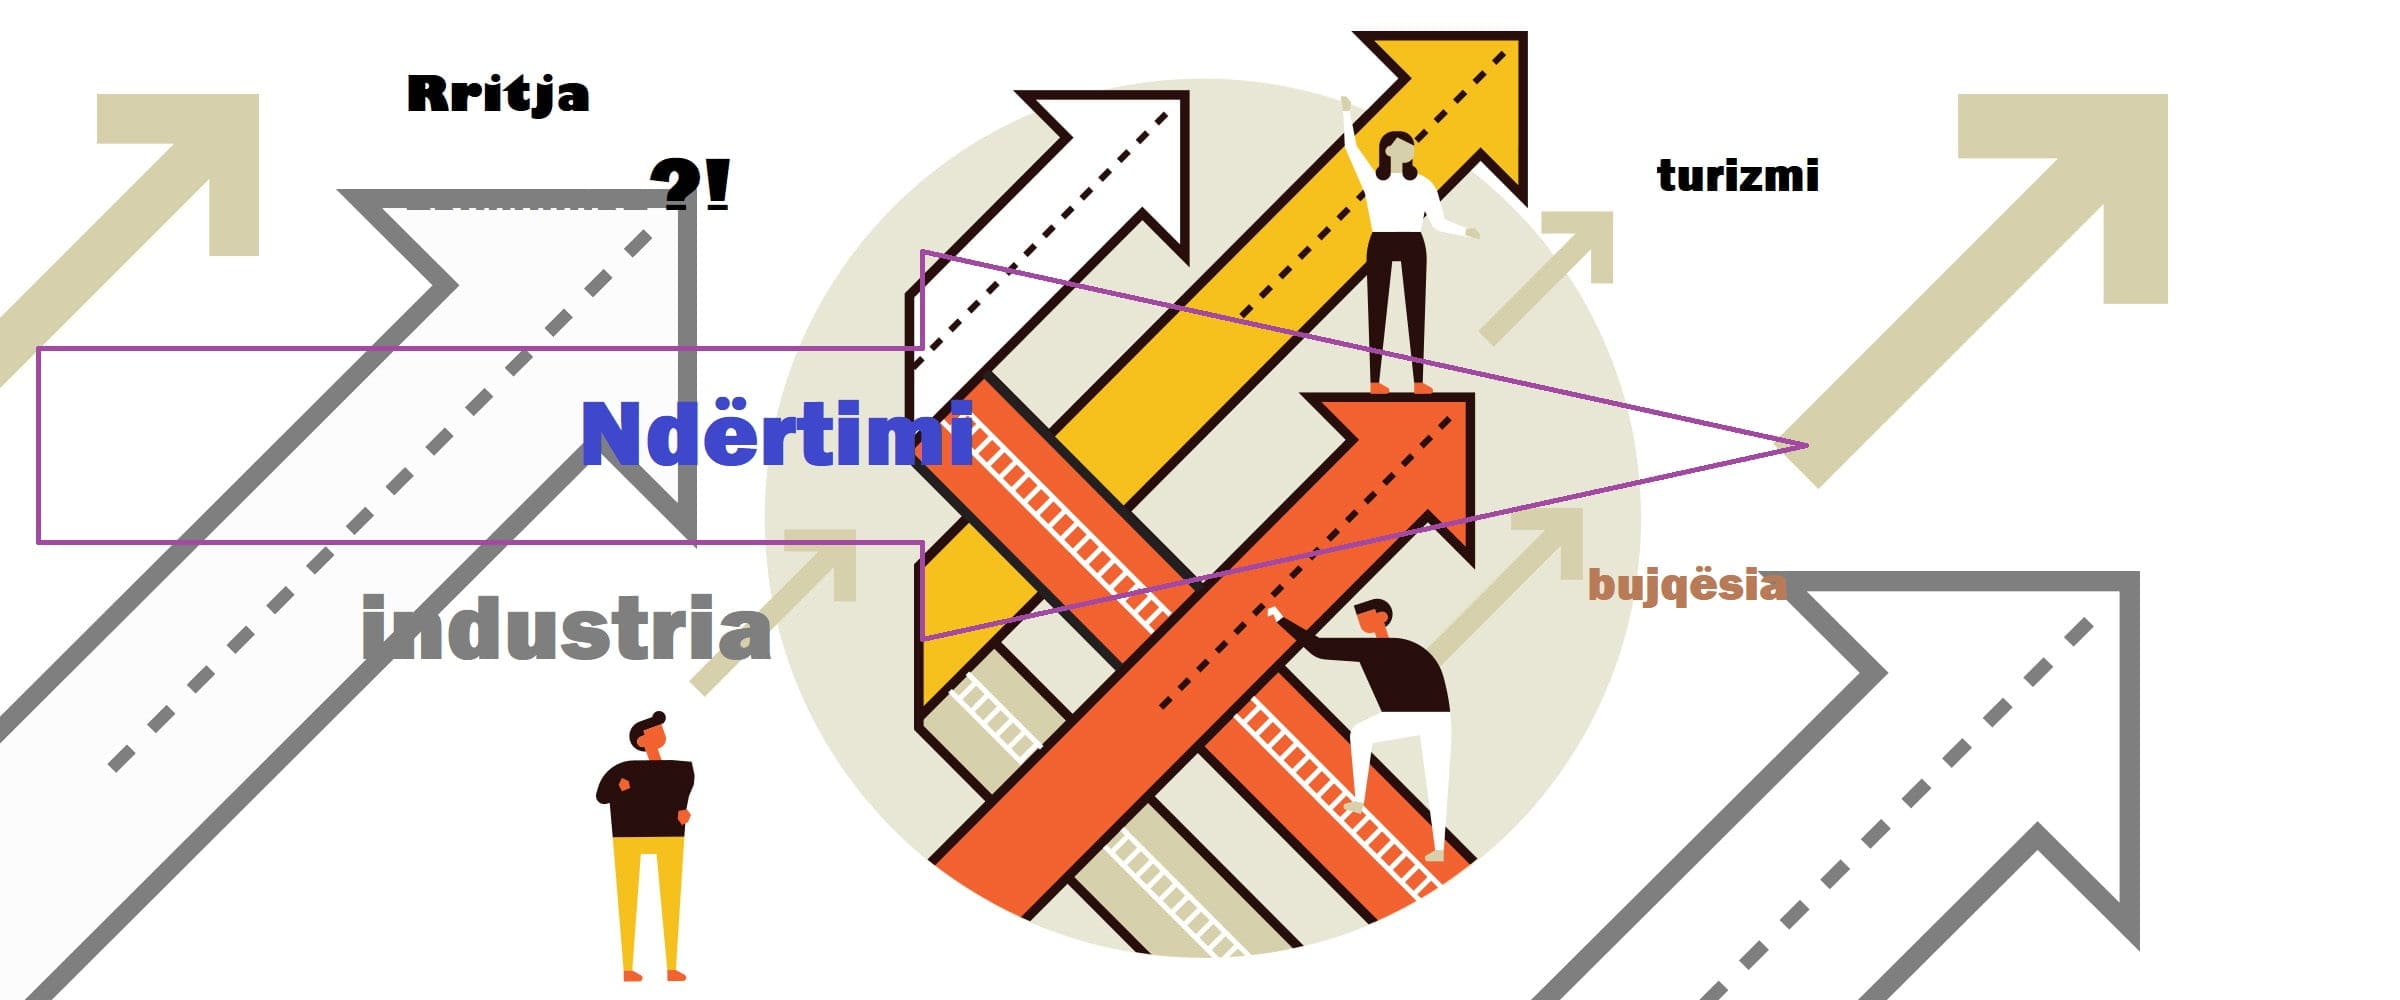
Economic growth of the first quarter in 2024 and of the past 10 years
Economic performance varies significantly between the first quarters of the last 10 years (2015 -2024).
In a comparative view of the gross domestic product (last column), according to the quarters between each other, the year 2020 shows a decrease in the added value of the economy by -2.24% and in 2015 there is a modest increase by 1.82%. Both of these periods constitute specifics of the development of the economy because in 2020 the blocking of most economic activities began, while in 2015 the economy showed a general disorientation due to the low consumption of the population and the government, low private investments and the decline of the value of net exports and imports of goods and services
But why are some quarters more competitive than others?
The comparison of GDP growth according to the first quarters of 2016 – 2019 presents an increasing curve, where from 3.69% economic growth in the first quarter of 2016 is followed by 4.29% growth in 2017, 4.06% growth in 2018 and a decrease in growth rates in 2.14% in 2019, which is slightly higher than in the first quarter of 2015.
After 2020 with an economic decline of -2.24%, the first quarter of 2021 marked a high growth of 5.33%, compared to the periods of the previous 6 years. The growth rates continued during the first quarter of 2022 with 7.22% and only a year later we have a decrease in the growth rates again with 2.6 times lower registering an increase of only 2.81%, slightly higher than the economic growth of the first quarter of 2019 .
Meanwhile, the first quarter 2024 records an increase with a slight upward trend of 3.63%.
GDP growth can be considered as a joint result of several factors. First, the performance of sectors/industries is significantly influenced by country-specific factors, such as: development policies and the business cycle. Secondly, it depends on specific factors, such as: demographic trends and the use of natural resources and the ability to increase productivity, to change the specialization of the industry to capture new market opportunities, to increase the efficiency of the local labor market and to invest in skills and innovation.
In retrospect, it seems that few of the influencing factors[1] have managed to be fulfilled to promote even higher economic growth.
Each of the components can be seen as an indicator of the determinants of economic performance. The average labor productivity, as an indicator for production productivity is at low levels [2], the specialization of the industry/economy, which is based on the contribution of priority industries with high added value, is still dependent on agro-agriculture and not to the sectors that really generate the opportunity for smart growth.
The employment rates, which measure the efficiency of the labor market, reflect a situation of increasing participation of the population in the economy, but the level of informality at work is also at high rates.
If we look at the participation rates, which summarize the characteristics of the labor force together with the age activity rates, we see a similar situation and with a not positive presentation to consider facing the challenges of the economy, mainly from the low level of participation of young people and a differentiation of gender equality at work and increasing the participation of the third age in the labor market, for economic reasons.
In this brief analysis of the influencing factors, we see that the control of the population for specific developments at work and the general demographic decline is not a positive situation, presented by Censi2023 with the aging of the population by more than 7 years compared to 13 years ago .
But, if we look at internal factors related to sectoral development policies (strategies), they are fulfilled up to half of their objectives (including sectoral reforms). Likewise, the cycle of productive businesses with an impact on economic growth, as will be presented below, has reached an end point with little potential for specializations to increase competitiveness through productivity and to enter new markets.
In a developmental sense, the Albanian economy should have a higher growth if we consider the natural resources and the capital created and carried after the 90s. Natural resources as a reserve that should only be used in long-term visions seem to be already largely depleted. Meanwhile, the re-creation of the urban and rural environment is not oriented by demographic trends to be used as economic assets, but by political-electoral, non-visionary and harmful approaches.
To a certain extent, resources that can be used and allocated more efficiently to generate a higher level of GDP per capita, such as: transport, general infrastructure, tourism-oriented facilities, market conditions of labor and human and social capital are little mobilized and harmonized through appropriate policies for the purposes of growth and increase of domestic capital and well-being.
The comparison between the quarterly economic growth for this period means the comparison of the rate of growth of the Albanian economy, which seems that for as long as there has been a growth rate, this has been accompanied by the good progress of the reforms undertaken and a lower level of corruption. This approach coincides with the period 2016-2018.
In these years, it can be seen that agriculture and its sub-sectors have grown together with production and professional and scientific activities, as well as recreational activities.
After 2020, the growth rates the following two years (2021 and 2022) later come as the inertia of filling the gap created in the consumption of the population and private investments created from 2020 and the end of 2019.
The highest growth rates, several times more than before, are maintained by construction, real estate and, depending on seasonality, the energy industry.
A rapid increase in GDP for the energy sector, construction and professional activities in relation to the country’s growth rate is due to seasonal transactions or a change in specialization towards sectors with growth and better utilization of infrastructure, as well as higher levels of more efficient skills for activities related to services and trade, including some agritourism and outsourced production from foreign markets.
Since extractive industry growth is driven by comparative advantage, the portion of productivity growth that is due to non-renewable inputs (eg minerals, oil) can be seen as attributable to natural assets and not necessarily the effects of development policies. To the extent that infrastructure, technology and skills are reproducible resources, the rest of productivity growth can be considered a function of government policies, but which have nevertheless remained limited in their inclusive effects.
The increase in employment rates may be due to higher levels of greater labor market efficiency, as well as formalization over the years, starting from the previous legacy.
Even the relative increase in participation in economic activities may be the result of the increase in participation rates in all age groups, but with a difference for young age groups who prefer (seasonally or for a duration) the foreign labor market compared to the labor market local.
| GDP growth, first quarter 2015 – 2024 (%) | |||||||||||||||
| YEAR | Tr. | Agriculture | Extractive industry, energy, WS, waste | Construction | Commerce, transport, hotels, restaurants | Information and communication | Financial and insurance | Real estate | Scientific, professional, administrative | Public Administration | Arts, entertainment, family productions | Gross added value | Net Tax on outcome | GDP | |
| Total | Only Manifacture | ||||||||||||||
| 2015 | T1 | 1.11 | 5.89 | 0.75 | -6.18 | 1.11 | -0.41 | 14.27 | -3.76 | 15.84 | -0.22 | -2.13 | 1.63 | 3.19 | 1.82 |
| 2016 | 2.96 | 3.47 | 15.44 | 4.03 | 1.30 | 14.83 | 1.07 | 2.96 | 6.81 | 3.57 | 10.96 | 3.69 | 3.71 | 3.69 | |
| 2017 | 2.06 | -2.00 | 8.54 | 10.10 | 3.03 | 5.73 | 14.94 | 1.47 | 11.86 | 5.72 | 2.89 | 3.75 | 8.13 | 4.29 | |
| 2018 | 1.59 | 17.76 | 9.61 | 2.40 | 2.26 | -5.99 | -1.18 | -1.27 | 9.81 | 2.98 | 7.14 | 4.29 | 2.43 | 4.06 | |
| 2019 | 1.55 | -5.64 | 5.87 | 8.63 | 4.25 | 9.09 | 0.68 | 7.52 | 7.14 | 3.55 | -11.56 | 2.35 | 0.69 | 2.14 | |
| 2020 | 2.97 | -6.55 | -6.08 | -17.10 | -0.77 | -7.82 | 0.36 | -0.27 | -7.25 | 1.74 | 5.91 | -2.26 | -2.11 | -2.24 | |
| 2021 | 1.32 | 10.71 | 11.19 | 20.29 | -1.45 | 9.32 | 17.01 | 3.96 | -1.87 | 7.63 | 5.43 | 5.08 | 6.99 | 5.33 | |
| 2022 | -0.06 | 7.47 | 13.08 | 25.29 | 12.13 | 12.74 | 7.89 | 12.31 | 15.04 | -0.45 | -15.86 | 7.23 | 7.13 | 7.22 | |
| 2023 | 0.01 | 3.21 | 0.82 | 5.20 | 3.72 | 5.49 | 1.36 | 10.99 | -0.65 | 3.10 | 30.29 | 3.68 | -2.78 | 2.81 | |
| 2024 | -1.73 | -1.05 | -6.75 | 14.04 | 4.63 | 2.14 | 2.83 | 5.91 | 5.54 | 7.71 | 1.97 | 3.74 | 2.80 | 3.63 | |
| https://www.instat.gov.al/media/13612/web_tab1-t1-24-prodhim.xlsx | |||||||||||||||
As younger individuals tend to have lower participation rates, the difference in activity rates due to the age profile of the population can be seen as a result of poor management of the country’s resources and assets. In clarifying the economic rates of the first quarters, but also the annual economic growth, it can be seen that the estimate for a stable growth for Albania can be considered unstable, since the rate of consistent growth has not been maintained throughout the years. On the other hand, the economic growth mainly after 2020 based on construction and real estate has caused other economic problems mainly in agriculture and processing industry (without energy and extractive industry).
The data and analysis reflect facts that economic growth is uneven between sectors of the economy, but also between sectors that are considered priorities (with high return on investment), not generating well-being for everyone, but influencing in many cases the damage and environmental pollution.
Meanwhile, sustainable economic growth refers to activities that support long-term economic growth without negatively affecting the social and cultural aspects of communities.
In summary, we think that it is not healthy for the country when a long-term economic growth depletes natural, capital and human resources and its impact should be seen in living standards and the protection and enrichment of the environment where we live.
[1] Productivity, Industry specialization, Employment rates, Participation rates, Age activity rates, Population
[2] https://www.ceicdata.com/en/indicator/albania/labour-productivity-growth

Leave a Reply
You must be logged in to post a comment.