


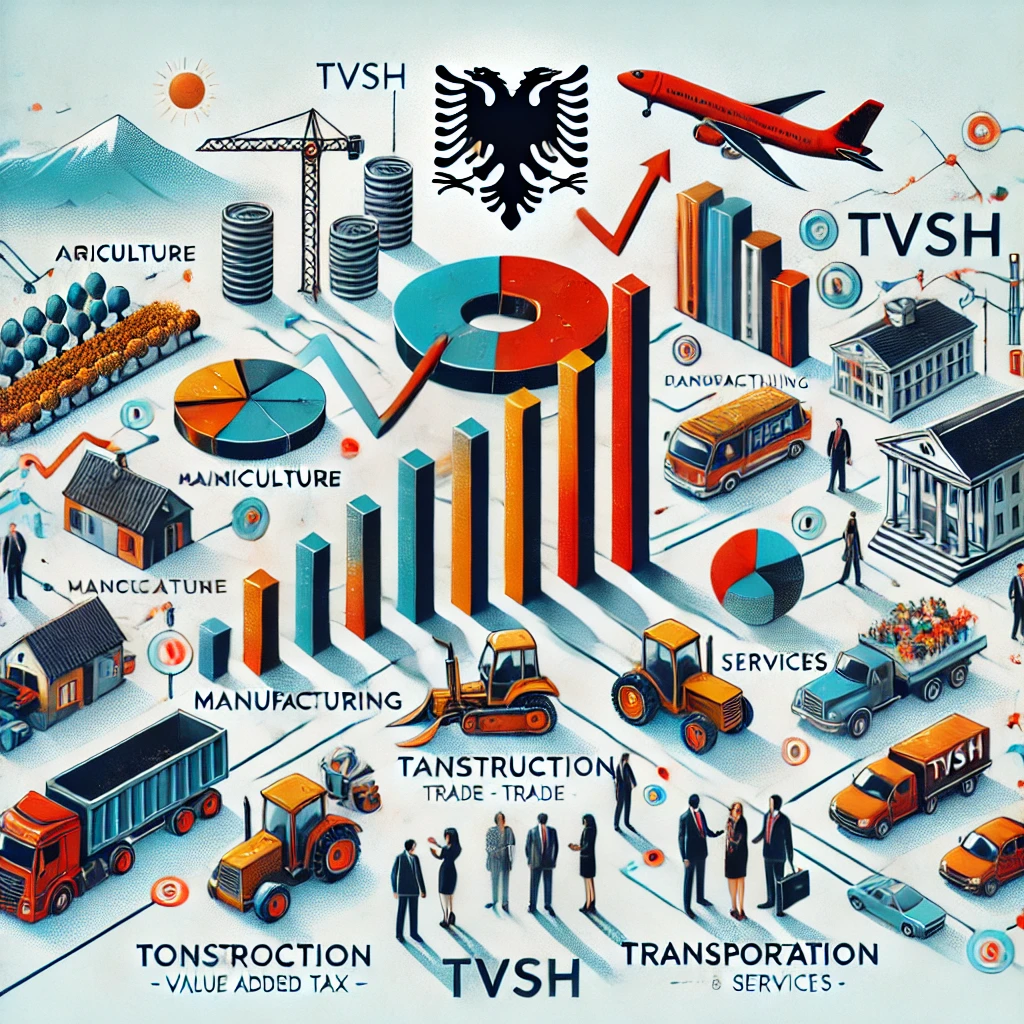
Tax revenues in relation to Albanian economic development (2023–2024)
By analyzing the data on tax revenues according to the 2024 annual report of the General Directorate of Taxes and comparing it to GDP by sectors, a trend of increasing revenues is noted, but not necessarily in line with the real performance of the economy.
GDT Table 2024 vs. 2023
| Description | Actual 2023 (in ALL) | Plan 2024 (in ALL) | Actual 2024 (in ALL) | Difference (Actual vs. Plan) | Percentage (+/-) | Difference (2024 vs. 2023) | Percentage (+/-) |
| A. TOTAL TAX DIRECTORATE (Gross) | 357,132,812 | 405,647,901 | 400,544,050 | 5,103,851 | 1.27% | 48,515,088 | 13.58% |
| A. Total Tax Revenues | 217,877,895 | 249,777,085 | 246,886,050 | 2,891,035 | 1.17% | 31,899,191 | 14.64% |
| 1. VAT (gross) | 68,657,656 | 82,155,813 | 77,875,000 | 4,280,813 | 5.50% | 13,498,158 | 19.66% |
| – VAT (net) | 46,043,114 | 59,782,174 | 55,239,000 | 4,543,174 | 8.22% | 13,739,060 | 29.84% |
| – Reimbursements | 22,614,542 | 22,373,640 | 22,636,000 | (262,360) | -1.16% | (240,902) | -1.07% |
| 2. Profit Tax | 54,986,282 | 57,494,691 | 59,719,000 | (2,224,309) | -3.72% | 2,508,409 | 4.56% |
| 3. Personal Income Tax | 57,999,211 | 66,746,937 | 64,439,000 | 2,307,937 | 3.58% | 8,747,726 | 15.08% |
| 4. National Taxes and Fees | 14,339,846 | 19,536,403 | 19,210,294 | 326,109 | 1.70% | 5,196,557 | 36.24% |
| 5. Road Circulation Tax | 19,545,556 | 21,301,954 | 23,305,031 | (2,003,077) | -8.60% | 1,756,399 | 8.99% |
| 6. Gambling | 2,176,798 | 2,303,120 | 2,337,725 | (34,605) | -1.48% | 126,322 | 5.80% |
| 7. Other Administrative Penalties | 172,545 | 238,166 | 0 | 238,166 | 100% | 0 | 0% |
| B. Tax Revenues (net) | 195,263,353 | 227,403,446 | 224,250,050 | 3,153,395 | 1.41% | 32,140,093 | 16.46% |
| C. Social Insurance Contributions | 139,254,918 | 155,870,816 | 153,658,000 | 2,212,816 | 1.44% | 16,615,897 | 11.93% |
| D. TOTAL TAX DIRECTORATE (Net) | 334,518,271 | 383,274,261 | 377,908,050 | 5,366,211 | 1.42% | 48,755,990 | 14.57% |
A critical analysis of the key indicators is provided below:
1. Growth of tax revenues and sectoral contribution
Net tax revenues increased by 16.46% compared to 2023, while social insurance contributions grew by 11.93%. This significant increase in fiscal revenues must be analyzed in the context of economic growth and tax policies.
📌 Mismatch with economic growth
With an economic growth of 3.94% in 2023, the increase in tax revenues by over 16% suggests an additional fiscal burden or an increase in the formalization of the economy.
This could be due to reforms in tax administration, rising prices of goods and services (inflation), or efforts to reduce tax evasion.
2. VAT and Inflation
Gross VAT increased by 19.66%, while net VAT increased by 29.84%.
The higher growth of net VAT compared to gross VAT indicates either a reduction in reimbursements or an increase in domestic consumption.
VAT reimbursements fell by 1.07%, raising concerns for exporting businesses and sectors dependent on international supply chains.
📌 Key issues and subject to discussion
Inflation and rising prices have influenced the increase in VAT revenues.
Reduced reimbursements may reflect tighter fiscal policies toward exporting businesses.
3. Profit Tax – Slow growth
Profit tax increased by only 4.56%, a growth lower than the economic growth rate.
This indicator suggests:
- Business profits have not increased significantly.
- Net profits may have declined due to rising operational costs.
- Possibility of high tax evasion or fiscal exemptions for certain business categories.
4. Personal Income Tax – Pressure on taxpayers
A 15.08% increase, higher than wage or employment growth in the economy.
This could result from:
- Formalization of labor (reduced evasion).
- Harsher progressive tax on middle and higher incomes.
- Wage increases in sectors like construction and technology.
📌 Debatable issues
- Rising living costs and pressure on individual incomes may negatively affect purchasing power.
- Risk of tax burden pushing toward tax evasion or labor migration.
5. Growth of national taxes and fees – Effects of fiscal policies
Revenues from national taxes and fees rose by 36.24%, an exceptionally high increase.
This may be linked to:
- Increased administrative fees by the government.
- Taxes on imported goods and customs policy changes.
- Rising prices influencing the nominal value of taxes.
📌 Discussion point
If this increase comes from administrative fees and not real economic activity, it could be an added burden on businesses and citizens.
6. Road Circulation Tax – Why is the increase higher?
The road circulation tax rose by 8.99%, although fuel consumption did not increase significantly.
This may stem from:
- Fuel price and excise increases.
- Fiscal policies encouraging alternative transport use.
📌 Debate point
This tax directly impacts the price increase of goods and services, contributing to inflation.
7. Insurance Contributions – Why higher than expected?
Insurance contributions increased by 11.93%, more than wage or employment growth.
This may come from:
- Formalization of jobs.
- Minimum wage increases and higher wages, without changes in the insurance scheme.
📌 Discussion point
If contribution growth exceeds wage growth, it may indicate a heavier burden on businesses and employees.
Summary highlights
📌 Positive Trends:
✔ Growth in tax revenues indicates a broader fiscal base.
✔ Formalization of the economy appears to have influenced insurance and personal tax revenues.
✔ More VAT revenues point to stable consumption, though inflation played a role.
⚠ Negative Trends:
❌ Profit tax has not increased sufficiently, suggesting lower profits or tax evasion.
❌ Reduction in VAT reimbursements is problematic for exporters and supply-dependent businesses.
❌ Increased tax burden on citizens and businesses may affect purchasing power and investment.
🔎 We continue to recommend:
1️⃣ Lowering personal income tax to stimulate consumption and investment.
2️⃣ Facilitating VAT refunds for exporting businesses.
3️⃣ Monitoring tax evasion, especially in profit tax and sectors with fiscal exemptions.
4️⃣ Evaluating the impact of new taxes and fees to avoid excessive burden on citizens and businesses.
This analysis shows that while tax revenues have increased, this is primarily due to increased fiscal burden and inflation, rather than genuine economic activity growth.


Leave a Reply
You must be logged in to post a comment.