
Architecture of public projects in Albania
To deeply understand the problem of delays, it is essential to create a clear ‘map’ of the architecture of public investments. This section presents the structure of the infrastructure investment portfolio, classifying projects by sector, size, region and maturity level.
The analysis rests on 350–400 projects detailed in the original files (Road Transport, Water & Sewerage, Drainage/Irrigation, AADA) and has been supplemented with official PPD 2027–2029 data, comprising 121 projects worth €14.83 billion in total.
Classification by Sector, Region and Project Size
- Sectors involved – Road, Water Supply & Sewerage, Drainage & Irrigation, Urban/Rural/Tourism Development (AADA).
- Regions – North (Shkodra, Lezha, Dibra), Centre (Tirana, Elbasan, Durres), South (Vlora, Fier, Saranda, Gjirokastra), Multi-region.
- Size – Small projects (< €5 mn), medium (€5–50 mn), large (> €50 mn).
- Project maturity – Fully Mature (completely ready for implementation), Partially Mature (some elements completed), Immature (only idea or concept study).
Aggregate Portfolio Matrix
| Sector | No. of projects (approx.) | % Fully Mature | Avg. Delay (years) | Cost Increase (%) | Share of total portfolio (%) | Key note |
| Road | 45–55 + PPD transport | 36% | 2.2–3.8 | 25–40 | 33% | Dominates portfolio; high delays in ring roads and corridors |
| Water & Sewerage | 90–120 | <30% | 3.2–4.8 | 20–35 | 25% | Highest delays; technically complex projects |
| Drainage & Irrigation (04240) | 80–100 | 40% | 1.2–2.7 | 15–35 | 15% | Lower delays, but still systemic |
| AADA (urban, tourism, 100 Villages) | 120–150+ | 25% | 2.5–5.0 | 20–60 | 27% | Highest in urban regeneration and tourism |
| PPD 2027–2029 (total) | 121 | 36% | — | — | 100% | Only 36% fully ready for implementation |
Total analysed portfolio it is 350–400 projects from original files + 121 official projects from PPD 2026–2028 and PPD 2027–2029.
Figure 3. Over-programming: PPD 2027–2029 Portfolio vs. Real Fiscal Capacity – ALTAX Observatory 2026
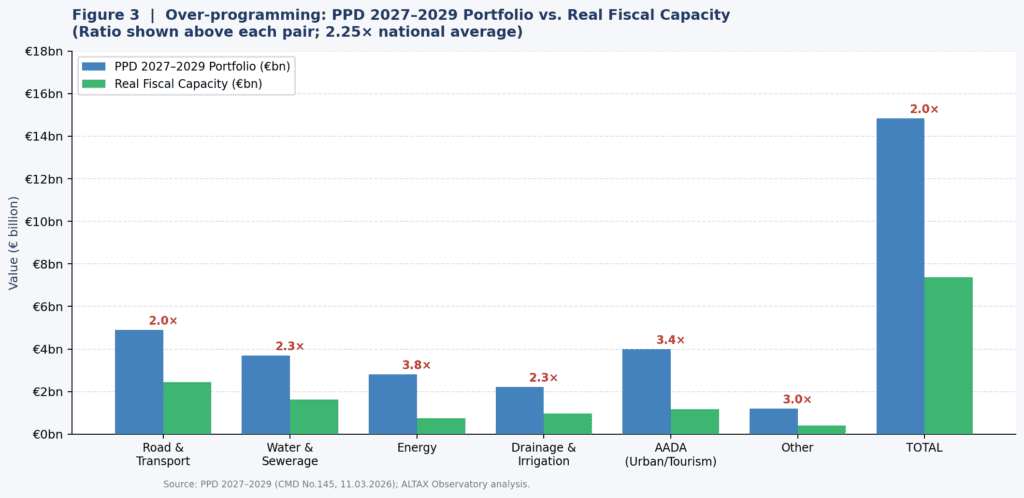
From the analysis of this database, the following situation results:
• Dominated by the road sector with 33% of the total value, road transport is the main driver of investments, but also the largest source of delays and additional costs. Projects such as the Tirana Ring Road and Corridor VIII have significant delays (up to 6–8 years).
• Water Supply & Sewerage has the largest number of projects (90–120), but the maturity is very low (<30%). The average delays are the highest (3.2–4.8 years), mainly due to technical complexity and fragmented financing.
• Drainage & Irrigation has relatively lower delays (1.2–2.7 years), because many projects are seasonal or simpler. However, they still suffer from budgeting spread over years.
• ADF (urban development and tourism) has high delays (2.5–5 years) and cost overruns of up to 60%, especially in urban requalification and coastal/mountain tourism projects. These projects often have multiple phases and depend on coordination with municipalities.
The PPD (Political Priority Document) 2027 – 2029 as an official overview, where only 36% of the portfolio value is “fully mature”. This means that most of the projects planned for the next 3 years are not ready for immediate implementation, increasing the risk of new delays and cost overruns.
Why is this architecture important?
This matrix clearly shows that the problem is not uniformly distributed. It is concentrated in several sectors (road and urban) and regions (Center and South).
Large projects with high value tend to have higher delays and costs than small projects. This explains why, despite the relatively high level of investment (5–7% of GDP), real results for citizens remain limited.
In the later parts of the report (Lags and Costs Analysis, Case Studies, Indices), we will delve further into each sector, showing how the portfolio architecture directly affects its performance.
Analysis of Delays and Costs
This section is the analytical heart of the report. Here we present concrete data, precise calculations and in-depth interpretation of delays and additional costs in Albanian public investments.
The analysis is based on 350–400 projects from four main sectors (roads, water supply and sewerage, drainage/irrigation, ADF) and is complemented by official data from the 2027–2029 PDP.
Project Completion Rate
Finish Rate Index = 5–8%
This index measures the percentage of projects completed within the original planned deadline and achieving full functionality (in effective use by citizens or the economy).
- From original file data: Only 5–8% of projects (mainly small local ones from 2016–2018) are completed on time and are fully operational.
- In PPD 2027–2029: Only 36% of the portfolio’s total value (€5.29 billion out of €14.83 billion) is classified as ‘fully mature’. However, this figure is optimistic, as most of them are still in early implementation phases.
Albania has a ‘planning illusion’. The list of projects is long, but only a very small fraction manages to finish on time and deliver real benefits. This is one of the main reasons why public investments do not produce the expected economic effect.
Delay Duration (Delay Intensity)
Global average: 900–1,800 days (2.5–5 years per project).
Distribution by sector:
- Road: 800–1,400 days (2.2–3.8 years)
- Water & Sewerage: 1,170–1,750 days (3.2–4.8 years) — highest
- Drainage & Irrigation: 450–900 days (1.2–2.7 years) — lowest
- AADA (urban, tourism, 100 Villages): 900–1,800 days (2.5–5 years)
In the full-matching analysis of 30 identical projects between PPD 2026–2028 and PPD 2027–2029, 73% have not changed status. This means the majority of projects remain ‘stuck’ for years without real progress.
Distribution by region (approximately):
- Centre (Tirana, Elbasan, Durres): 1,200–1,800 days
- South (Vlora, Fier, Saranda): 1,100–1,700 days
- North (Shkodra, Lezha, Dibra): 900–1,400 days
- Multi-region / Rural: 1,300–1,900 days
Cost Overruns
National average 25–40% (up to 60% in some categories).
Distribution by sector:
- Road 25–40%
- Water & Sewerage 20–35%
- Drainage & Irrigation 15–35%
- AADA (urban + tourism) 20–60% (highest in urban regeneration and tourist projects)
Real examples:
- Tirana Outer Ring Road 30–40% cost overrun + 6–8 year delay.
- Llogaras Tunnel, inflated cost due to geological challenges.
- Peqin-Kavaje Canal, delay + repeated addenda.
- Vlora Urban Regeneration (Clock Tower) up to 50–60% cost increase due to multiple phases.
Main reasons for cost increases:
- Material inflation (cement, steel, bitumen), especially 2021–2024.
- Contract addenda and design changes.
- Delays leading to indirect cost increases (supervision, penalties, additional VAT).
- Difficult terrain (mountainous or coastal).
Tabular Analysis
| Category | % with delay | Avg. delay (years) | Cost increase (%) | Annual budget impact (approx.) |
| Road | 80% | 2.2–3.8 | 25–40 | 8–12 billion ALL |
| Water & Sewerage | 97–98% | 3.2–4.8 | 20–35 | 6–10 billion ALL |
| Drainage & Irrigation | 70–80% | 1.2–2.7 | 15–35 | 4–7 billion ALL |
| AADA (urban + tourism) | 92–95% | 2.5–5 | 20–60 | 10–15 billion ALL |
| PPD 2027–2029 (total) | — | — | — | Over-programming €9.2 billion |
On-Time vs. Delayed Projects
On time, 5–8% (mainly small local projects from 2016–2018 that did not require multiple phases).
Delayed, 92–95% (the vast majority of strategic projects, such as ring roads, corridors, large water supplies, urban and tourist regeneration).
Distribution by year of start:
- Projects 2016–2020 with 60–70% with delay.
- Projects 2021–2025 with 85–95% with delay.
- Projects planned 2026–2029 are expected to have high delays if no immediate action is taken.
Delays and cost overruns are no longer the exception, but have become the rule in the Albanian public investment system. With a global average of 2.5–5 years of delay and 25–40% cost overruns, Albania loses hundreds of millions of euros in efficiency and thousands of years of productivity every year. This analysis shows that the problem is systemic, not random, and requires immediate structural intervention.
* Excerpt from the study Public Investment Implementation Deficit in Albania.


Leave a Reply
You must be logged in to post a comment.